图表示例
柱状图
python
from pdf_generator import PDFReportGenerator
import pandas as pd

data = pd.DataFrame({
    "产品": ["产品A", "产品B", "产品C", "产品D"],
    "销量": [150, 230, 180, 310]
})

config = {
    "metadata": {"title": "柱状图示例"},
    "elements": [
        {"type": "text", "content": "产品销量对比", "style": "title"},
        {
            "type": "chart",
            "chartType": "bar",
            "dataSource": "sales",
            "xAxis": "产品",
            "yAxis": "销量",
            "title": "销量对比图",
            "width": 6,
            "height": 4,
            "grid": true
        }
    ]
}

generator = PDFReportGenerator(config_dict=config)
generator.add_data_source("sales", data)
generator.save("output/bar_chart.pdf")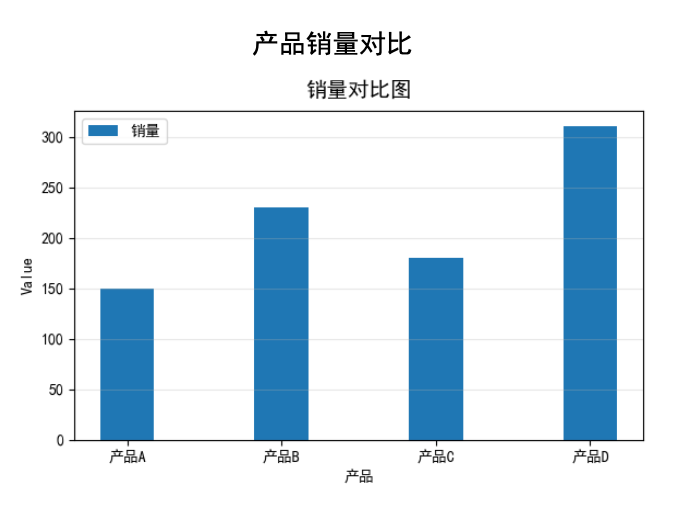
折线图
python
from pdf_generator import PDFReportGenerator
import pandas as pd

data = pd.DataFrame({
    "月份": ["1月", "2月", "3月", "4月", "5月", "6月"],
    "收入": [100, 120, 115, 140, 160, 180],
    "成本": [80, 85, 82, 90, 95, 100]
})

config = {
    "metadata": {"title": "折线图示例"},
    "elements": [
        {"type": "text", "content": "月度趋势", "style": "title"},
        {
            "type": "chart",
            "chartType": "line",
            "dataSource": "trend",
            "xAxis": "月份",
            "yAxis": ["收入", "成本"],
            "title": "收入与成本趋势",
            "width": 7,
            "height": 5,
            "grid": true,
            "showLegend": true
        }
    ]
}

generator = PDFReportGenerator(config_dict=config)
generator.add_data_source("trend", data)
generator.save("output/line_chart.pdf")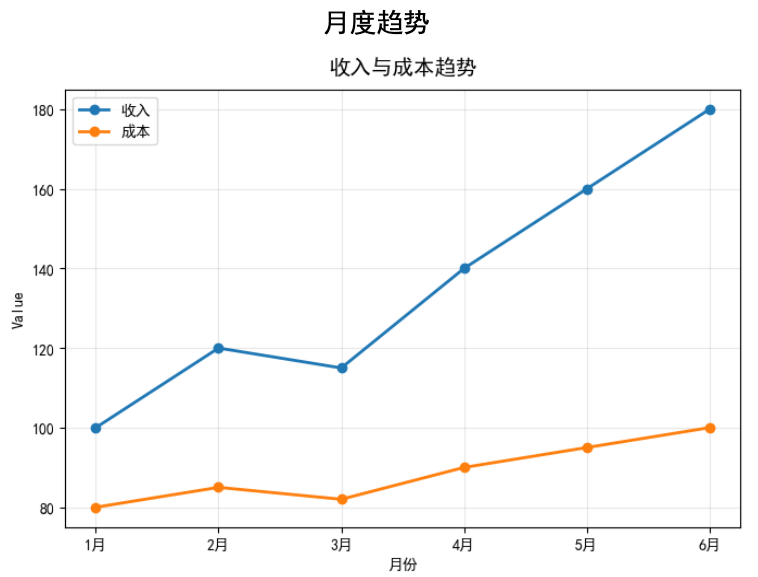
饼图
python
from pdf_generator import PDFReportGenerator
import pandas as pd

data = pd.DataFrame({
    "类别": ["电子产品", "服装", "食品", "家居", "其他"],
    "占比": [35, 25, 20, 15, 5]
})

config = {
    "metadata": {"title": "饼图示例"},
    "elements": [
        {"type": "text", "content": "销售占比", "style": "title"},
        {
            "type": "chart",
            "chartType": "pie",
            "dataSource": "category",
            "xAxis": "类别",
            "yAxis": "占比",
            "title": "产品类别占比",
            "width": 6,
            "height": 4,
            "showLegend": true,
            "legendPosition": "right"
        }
    ]
}

generator = PDFReportGenerator(config_dict=config)
generator.add_data_source("category", data)
generator.save("output/pie_chart.pdf")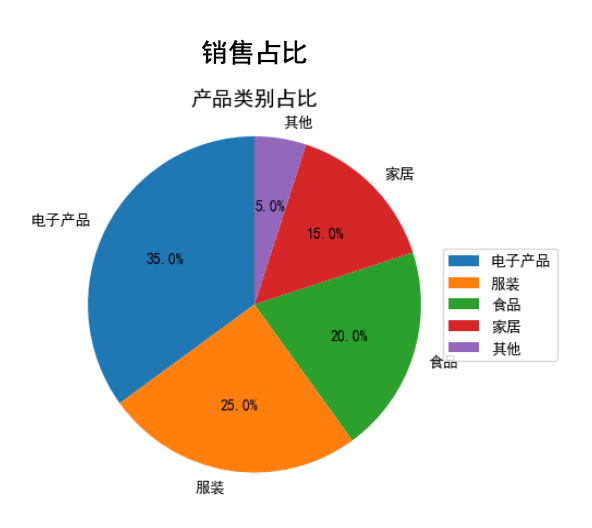
散点图
python
from pdf_generator import PDFReportGenerator
import pandas as pd
import numpy as np

np.random.seed(42)
data = pd.DataFrame({
    "x": np.random.randn(50) * 10,
    "y": np.random.randn(50) * 10
})

config = {
    "metadata": {"title": "散点图示例"},
    "elements": [
        {"type": "text", "content": "数据分布", "style": "title"},
        {
            "type": "chart",
            "chartType": "scatter",
            "dataSource": "points",
            "xAxis": "x",
            "yAxis": "y",
            "title": "散点分布",
            "width": 6,
            "height": 4
        }
    ]
}

generator = PDFReportGenerator(config_dict=config)
generator.add_data_source("points", data)
generator.save("output/scatter_chart.pdf")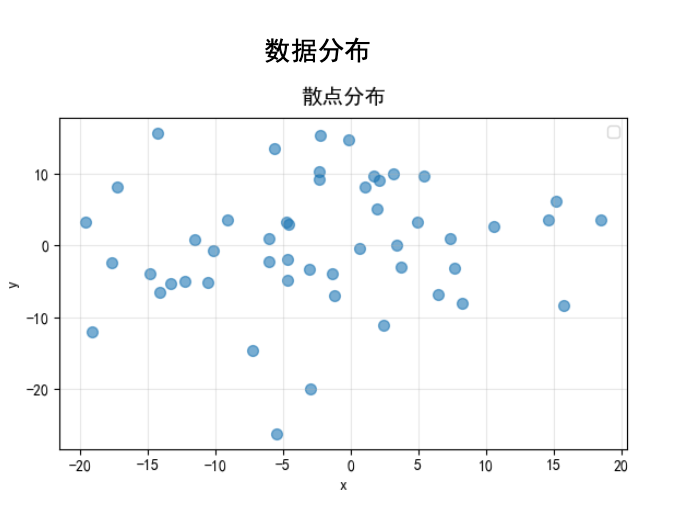
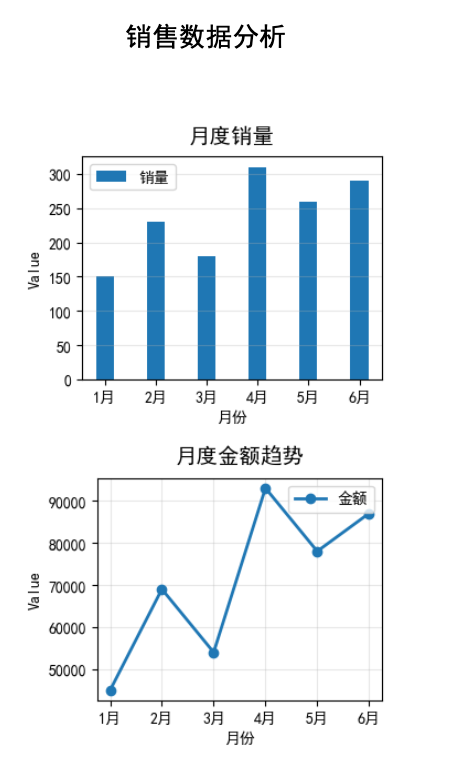
多图表组合
python
from pdf_generator import PDFReportGenerator
import pandas as pd

data = pd.DataFrame({
    "月份": ["1月", "2月", "3月", "4月", "5月", "6月"],
    "销量": [150, 230, 180, 310, 260, 290],
    "金额": [45000, 69000, 54000, 93000, 78000, 87000]
})

config = {
    "metadata": {"title": "多图表示例"},
    "elements": [
        {"type": "text", "content": "销售数据分析", "style": "title"},
        {"type": "spacer", "height": 0.5},
        {
            "type": "chart",
            "chartType": "bar",
            "dataSource": "sales",
            "xAxis": "月份",
            "yAxis": "销量",
            "title": "月度销量",
            "width": 3.5,
            "height": 3
        },
        {
            "type": "chart",
            "chartType": "line",
            "dataSource": "sales",
            "xAxis": "月份",
            "yAxis": "金额",
            "title": "月度金额趋势",
            "width": 3.5,
            "height": 3
        }
    ]
}

generator = PDFReportGenerator(config_dict=config)
generator.add_data_source("sales", data)
generator.save("output/multi_chart.pdf")