数据源示例
CSV 数据
python
from pdf_generator import PDFReportGenerator

config = {
    "metadata": {"title": "CSV 数据示例"},
    "dataSources": [
        {
            "name": "csv_data",
            "type": "csv",
            "path": "data/sales.csv"
        }
    ],
    "elements": [
        {"type": "text", "content": "CSV 数据展示", "style": "title"},
        {
            "type": "table",
            "dataSource": "csv_data",
            "columns": ["产品", "销量", "金额"]
        }
    ]
}

generator = PDFReportGenerator(config_dict=config)
generator.save("output/csv_data.pdf")
JSON 数据
python
from pdf_generator import PDFReportGenerator

config = {
    "metadata": {"title": "JSON 文件数据源"},
    "styles": {
        "table": {
            "gridColor": "#CCCCCC", "headerBackground": "#E67E22",
            "headerTextColor": "#FFFFFF", "fontSize": 10, "padding": 8
        }
    },
    "dataSources": [
        {"name": "expenses", "type": "json", "path": "data/expenses.json"}
    ],
    "elements": [
        {"type": "text", "content": "{{metadata.title}}", "style": "Title"},
        {"type": "text", "content": "数据来源: data/expenses.json"},
        {"type": "spacer", "height": 0.2},
        {"type": "table", "dataSource": "expenses", "style": "table"},
        {"type": "spacer", "height": 0.3},
        {
            "type": "chart", "dataSource": "expenses",
            "chartType": "bar", "xAxis": "类别", "yAxis": "金额",
            "title": "各类别支出对比", "width": 6.5, "height": 4, "grid": True
        },
    ]
}

generator = PDFReportGenerator(config_dict=config)
generator.save("output/json_data.pdf")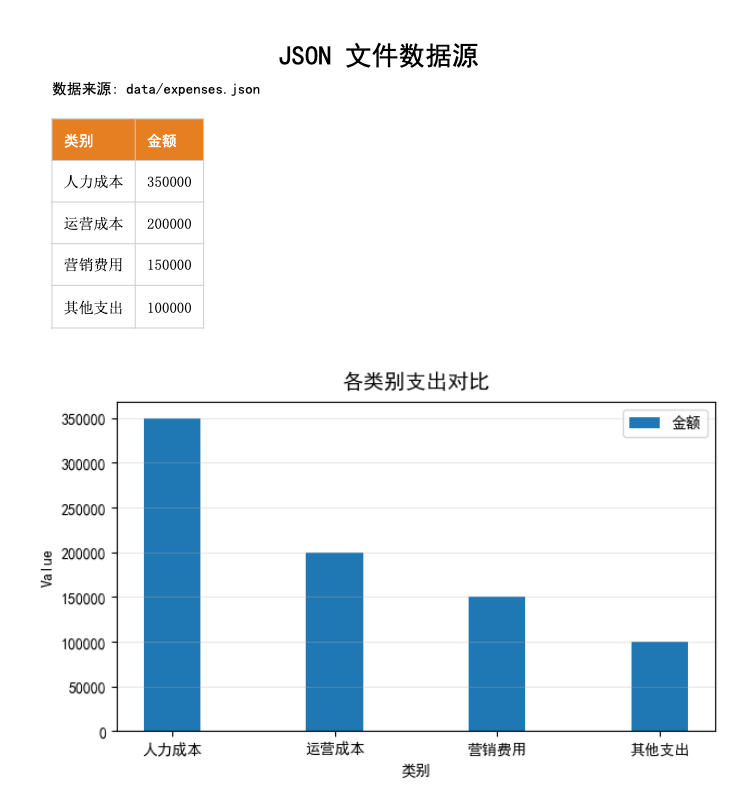
Excel 数据
python
from pdf_generator import PDFReportGenerator

config = {
    "metadata": {"title": "Excel 数据源"},
    "styles": {
        "table": {
            "gridColor": "#CCCCCC", "headerBackground": "#8E44AD",
            "headerTextColor": "#FFFFFF", "fontSize": 10, "padding": 8,
            "alternateRowColor": "#F5EEF8"
        }
    },
    "dataSources": [
        {
            "name": "sales",
            "type": "excel",
            "path": "data/sales.xlsx"
            # "sheetName": "Sheet1"   # 可选:指定 sheet 名称
        }
    ],
    "elements": [
        {"type": "text", "content": "{{metadata.title}}", "style": "Title"},
        {"type": "spacer", "height": 0.3},
        {"type": "text", "content": "数据来源: data/sales.xlsx(紫色主题 + 斑马纹)"},
        {"type": "spacer", "height": 0.2},
        {"type": "table", "dataSource": "sales", "style": "table"},
    ]
}

generator = PDFReportGenerator(config_dict=config)
generator.save("output/excel_data.pdf")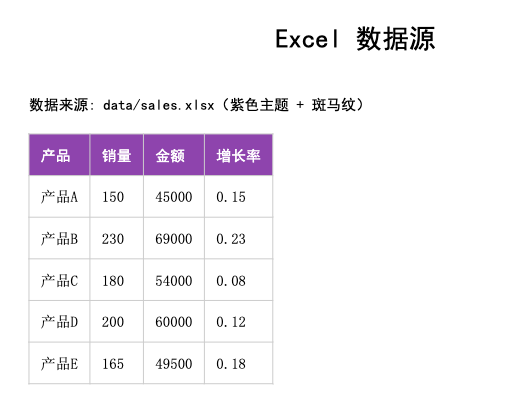
DataFrame 数据
python
from pdf_generator import PDFReportGenerator
import pandas as pd

# 创建 DataFrame
data = pd.DataFrame({
    "产品": ["A", "B", "C", "D"],
    "销量": [150, 230, 180, 310],
    "金额": [45000, 69000, 54000, 93000]
})

config = {
    "metadata": {"title": "DataFrame 示例"},
    "elements": [
        {"type": "text", "content": "DataFrame 数据展示", "style": "title"},
        {
            "type": "table",
            "dataSource": "sales"
        },
        {
            "type": "chart",
            "chartType": "bar",
            "dataSource": "sales",
            "xAxis": "产品",
            "yAxis": "销量"
        }
    ]
}

generator = PDFReportGenerator(config_dict=config)
generator.add_data_source("sales", data)
generator.save("output/dataframe.pdf")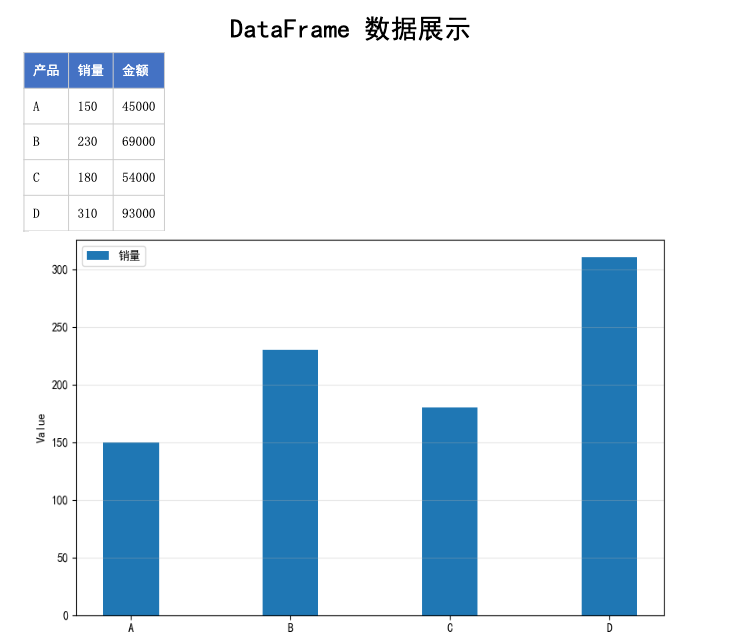
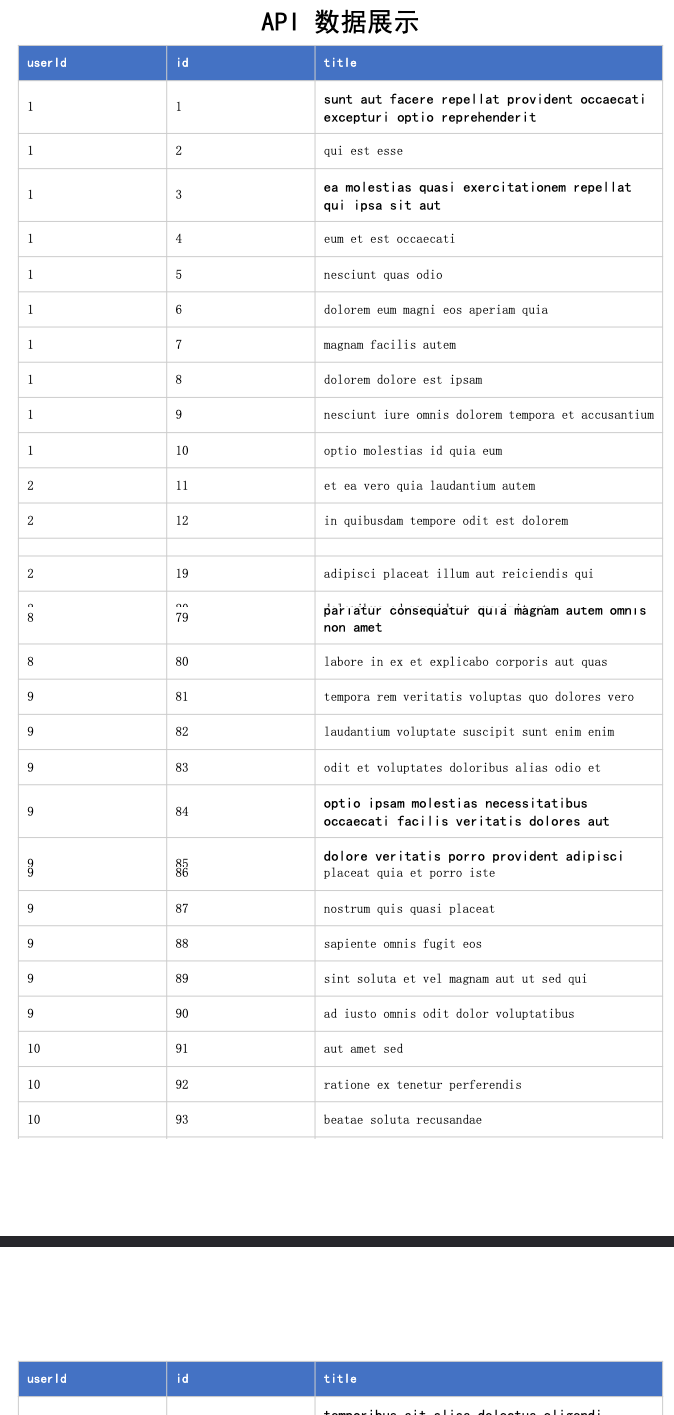
API 数据
python
from pdf_generator import PDFReportGenerator

config = {
    "metadata": {"title": "API 数据示例"},
    "dataSources": [
        {
            "name": "api_data",
            "type": "api",
            "url": "https://jsonplaceholder.typicode.com/posts",
            "method": "GET"
        }
    ],
    "elements": [
        {"type": "text", "content": "API 数据展示", "style": "title"},
        {
            "type": "table",
            "dataSource": "api_data",
            "columns": ["userId", "id", "title"]
        }
    ]
}

generator = PDFReportGenerator(config_dict=config)
generator.save("output/api_data.pdf")